What 10 Million Consumer Accounts Reveal About How Americans Are Spending (Q1 2026)
Every quarter, Atlas and Pave look at real transaction data across more than 10 million consumers — not sentiment surveys or market forecasts, but what people are actually buying, earning, and paying in real time.
This is the first edition of the Atlas Index. Here are five things the Q1 2026 data tells us about consumer spending trends right now.
1. You're Already Shopping Smarter
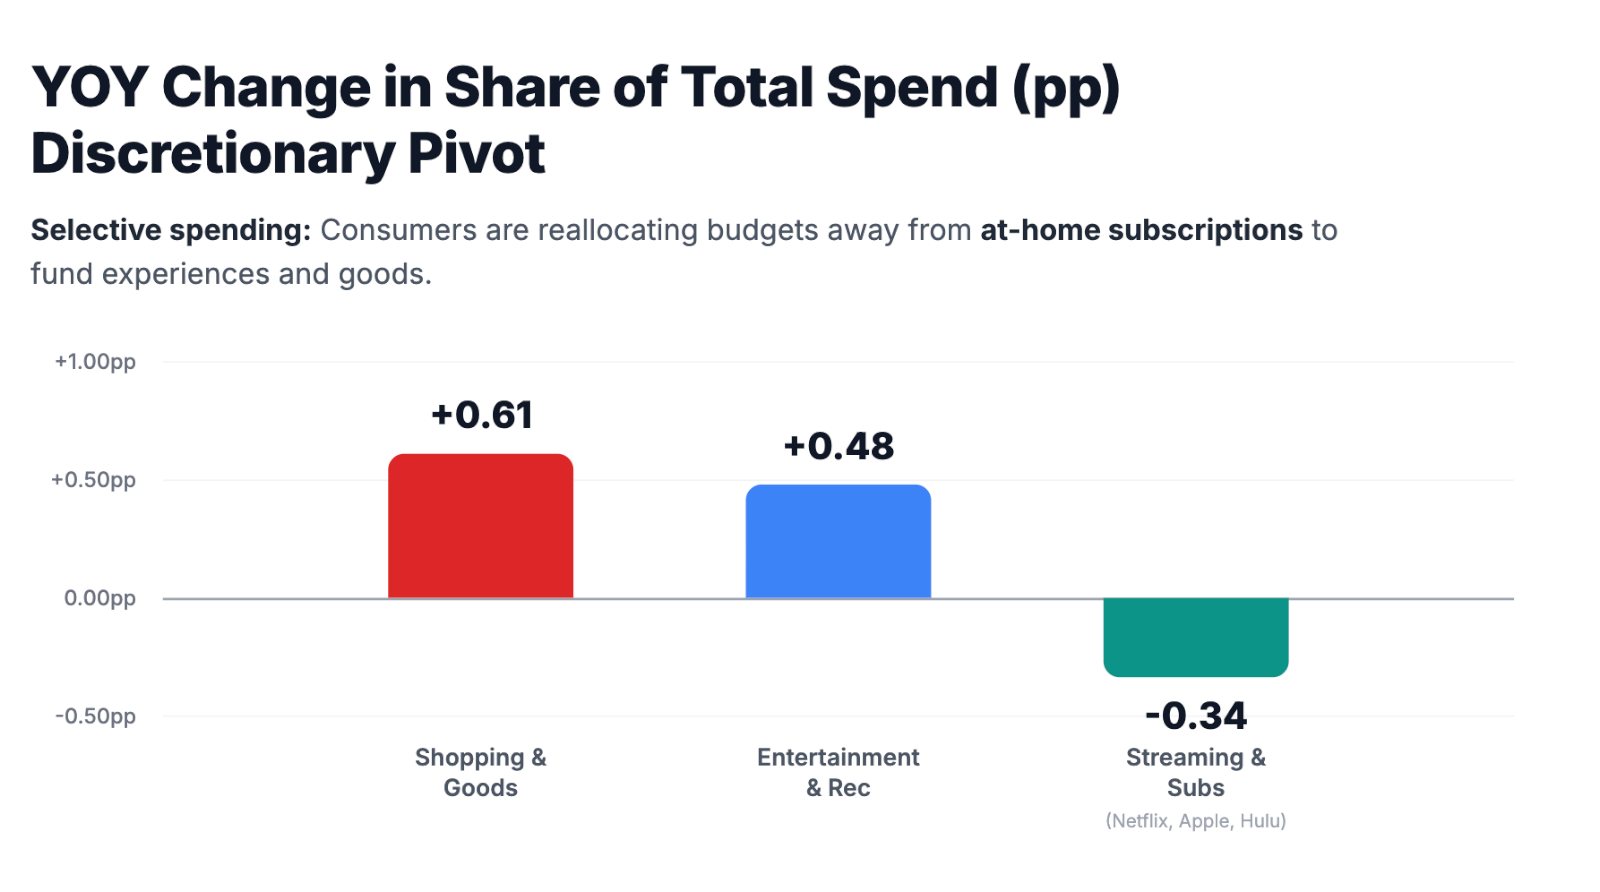
Here's something you probably already know but haven't seen confirmed in data: overall spending hasn't dropped, but where that money goes has shifted dramatically.
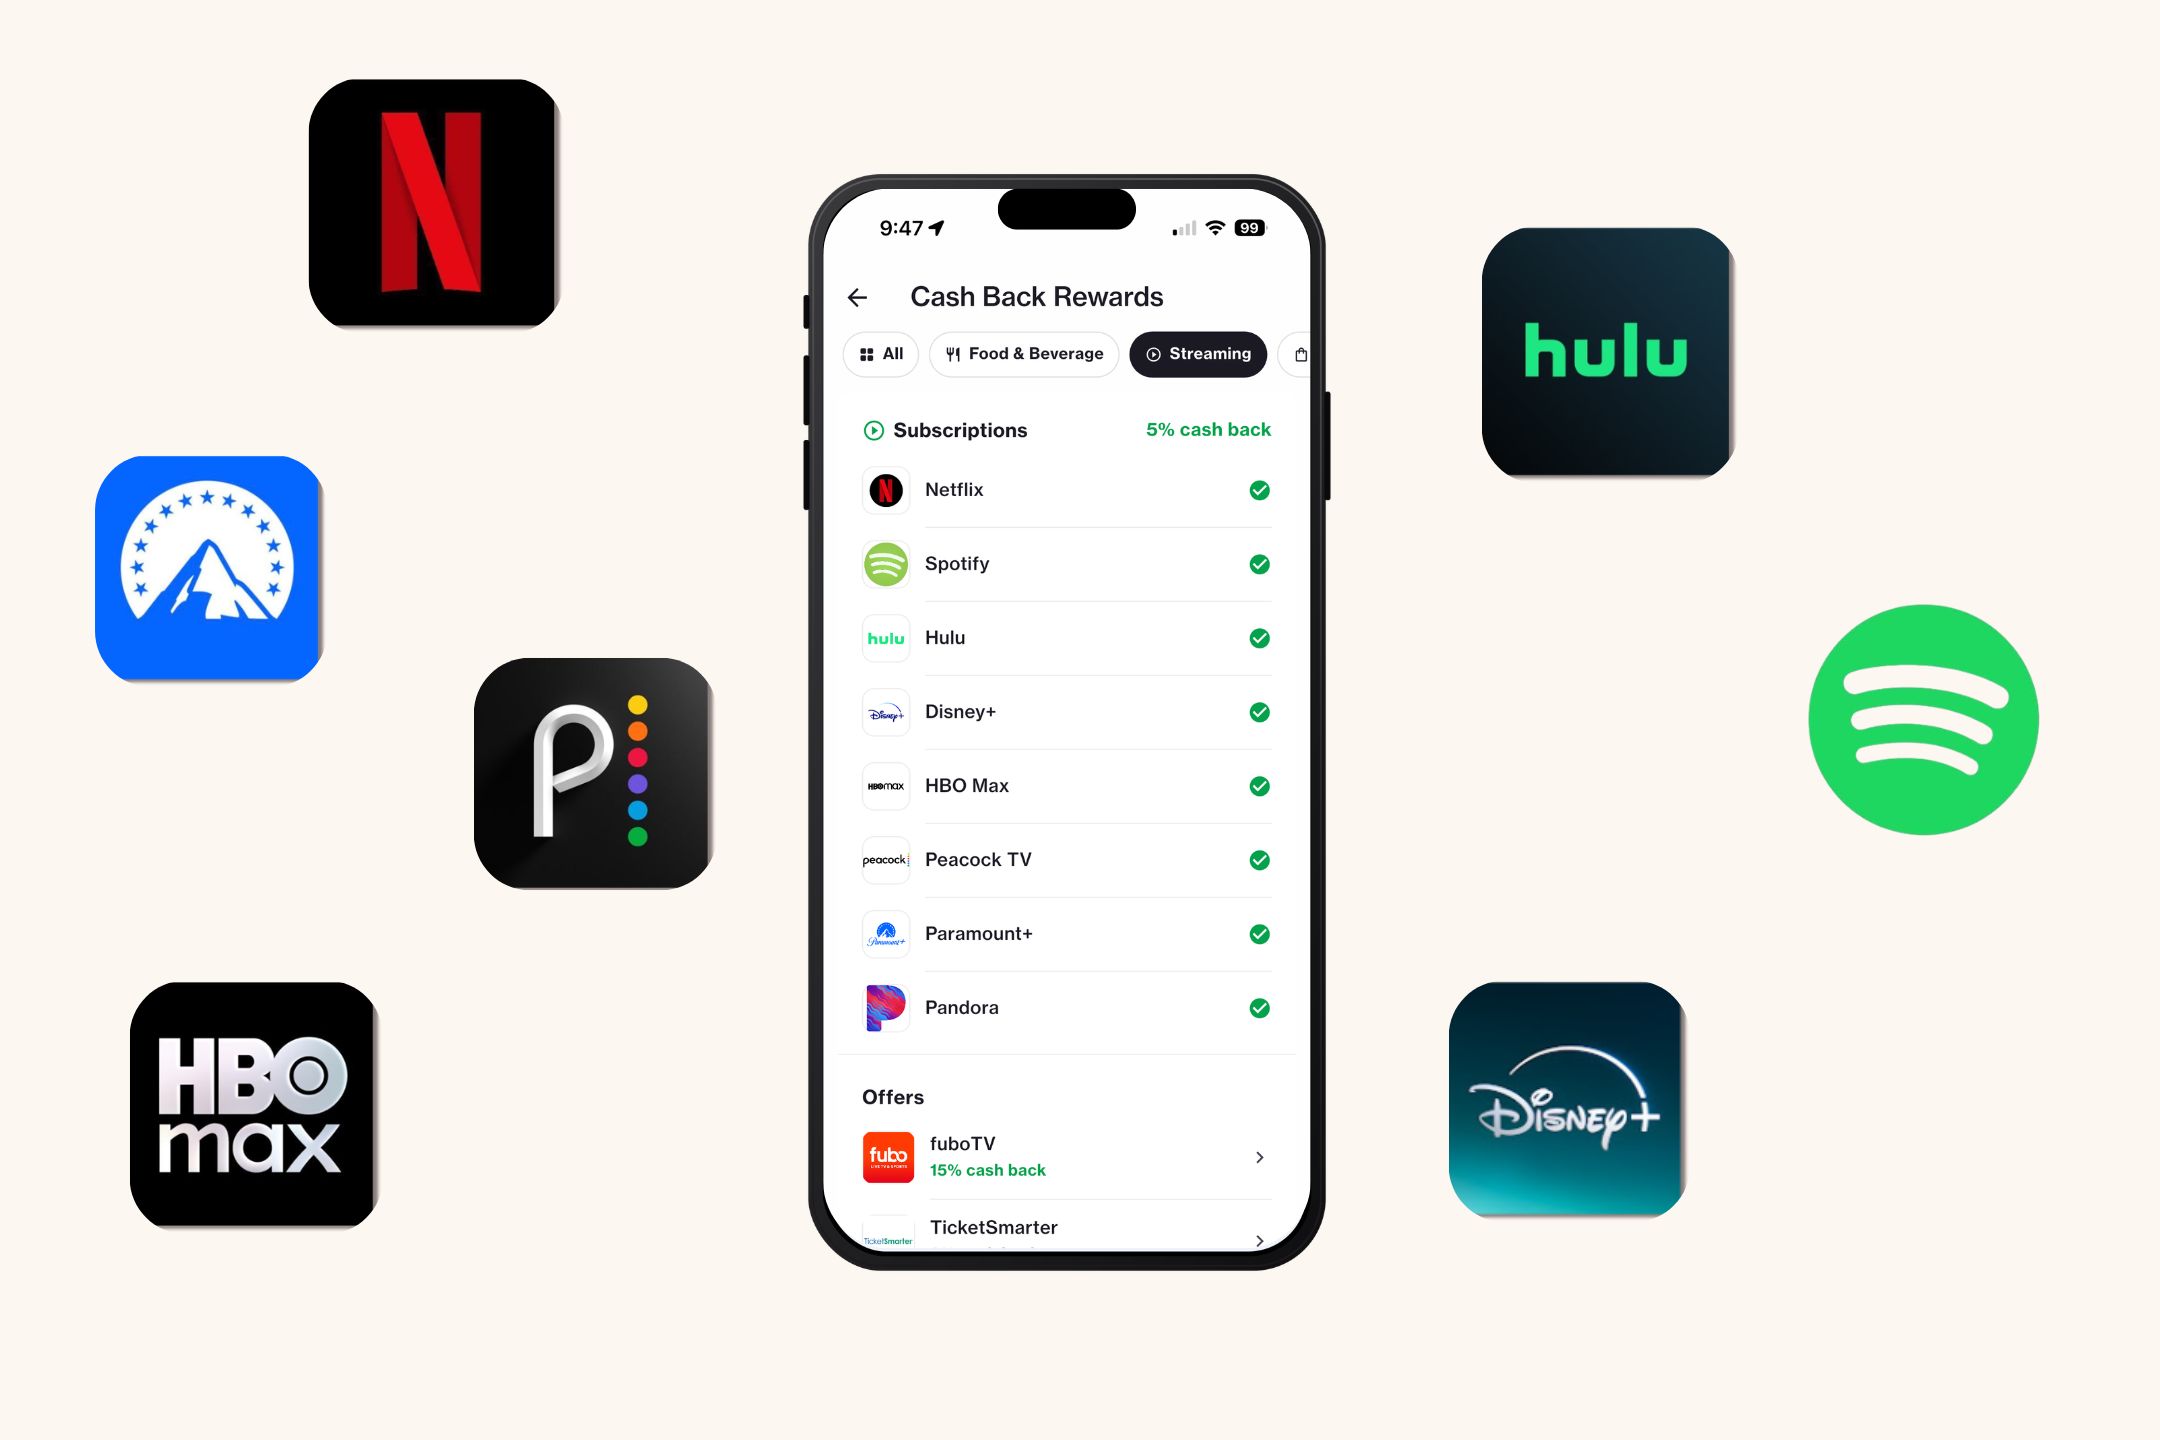
The clearest example? Subscriptions. Streaming and subscription spending fell this quarter, while spending on entertainment, recreation, and physical shopping all went up. People are canceling the autopay stuff and putting that money toward things they actually want to do.
Beyond subscriptions, the data shows consumers deliberately switching to store brands, comparing unit prices, and timing purchases around paychecks. It's showing up at the register, too: Walmart, Dollar General, Temu, and Dollar Tree all gained wallet share year-over-year, while Amazon lost ground. Walmart picked up the largest share of the shift.
2. Inflation Cooled Off (With One Thing to Watch)
Some of the reason people have more room to be strategic? Prices actually came down in key categories. The Consumer Price Index dropped to 2.4% in February 2026, down from 2.8% a year earlier. Utility costs have been falling for 15 straight months, which is real money back in people's pockets.
The caveat: gas prices are climbing again, driven by conflict in the Middle East. It hasn't erased the broader relief yet, but it's worth watching. If you've noticed your fill-up costing more lately, you're not imagining it.
3. Gig Workers Are Landing Steadier Paychecks
Among people who consistently earn gig income, reliance on that income dropped from roughly 75% in mid-2025 to about 50% by early 2026. Gig work itself isn't going away, but more and more gig workers are adding stable, payroll-based employment alongside it, or replacing it entirely.
Payroll income across the full dataset rose 5 to 6 percentage points from its January 2025 baseline. More people are anchored by predictable paychecks rather than piecing income together week by week. That's a meaningful shift.
4. The "Budgeting Wall" Is Real
Monthly financial distress rates hit 5.1% overall, and 6.0% for people earning under $50,000 a year. These are households that have already done the obvious things: switched to generic brands, canceled subscriptions, trimmed wherever they could. There's no more "fat" to cut.
We call this the budgeting wall. It's the point where the next cut isn't a streaming service. It's rent, utilities, or a loan payment.
This group is doing everything right with very little margin for error. And their experience is the “canary in the coal mine” for what broader consumer trends look like six months from now.
5. People Are Paying on Time — Down to the Day
One more thing worth knowing. The data shows that people are paying bills closer and closer to due dates, landing payments precisely on time rather than early.
That might sound like a warning sign, but it's actually a sign of how carefully people are managing cash flow. Higher-income households are paying steadily. Lower-income households are optimizing the timing, syncing payments with paychecks to keep everything current.
The takeaway: people are managing when they pay, not whether they pay, and that looks a lot more like resourcefulness than distress.
What We're Watching Next
The big picture from Q1 is a consumer in transition. People are adapting, reallocating, and finding steadier footing, but the margin for error is thin. Tax refunds gave a lot of households a real cushion this quarter. The question for Q2 is what happens when that cushion is gone. If the underlying stability holds without it, that's a strong signal. If credit reliance picks up, that tells a different story.
We'll also be watching gas prices, the gig-to-payroll trend, and whether the budgeting wall group stabilizes or grows.
This is why we publish the Atlas Index. The data tells us more about consumer’s day to day than the headlines do. We'll be back next quarter with the next edition.
The Atlas Index is powered by Atlas and Pave, using real-time behavioral and cash flow data across 10M+ consumer accounts. This cohort skews toward mainstream, fintech-adopting consumers and may not represent all segments. [Read the full Q1 2026 report →]
Apply In Minutes
• Just takes two minutes to apply 3
• 0% APR with limits that grow with you
• No credit history needed
By clicking "Get Started" you opt-in to receive account and marketing messages at the entered number and agree to Atlas' terms of service, mobile terms and privacy policy. Message frequency varies. Message and data rates may apply. You can opt-out at any time by replying STOP, or text HELP for support.

.jpg)